Feb 23, 2010
There’s no business like snow business
Anthony Watts, Watts Up With That
Headlines yesterday mentioned yet another new snowfall record: Moscow Covered by More Than Half Meter of Snow, Most Since 1966

Feb. 21 (Bloomberg) - Moscow’s streets were covered by 53 centimeters (20.9 inches) of snow this morning after 15 centimeters fell in 24 hours, putting Russia’s capital on course for its snowiest February since at least 1966.
Workers cleared a record 392,000 cubic meters (13.8 million cubic feet) of snow over the 24-hour period that ended this morning as precipitation exceeded the average February amount by 50 percent, according to state television station Rossiya 24. The city had 64 centimeters of snow cover on Feb. 23, 1966, the previous record, Rossiya 24 said.
In a story from Russia’s news agency, TASS, they mention that:
This year’s February is quite unique from the meteorological point of view. Not a single thaw has been registered so far and the temperature remains way below the average throughout the month.
I guess the Mayor of Moscow’s “Canute like” promise back in October didn’t work out so well. From Time magazine:
Moscow Mayor Promises a Winter Without Snow
Pigs still can’t fly, but this winter, the mayor of Moscow promises to keep it from snowing. For just a few million dollars, the mayor’s office will hire the Russian Air Force to spray a fine chemical mist over the clouds before they reach the capital, forcing them to dump their snow outside the city. Authorities say this will be a boon for Moscow, which is typically covered with a blanket of snow from November to March. Road crews won’t need to constantly clear the streets, and traffic - and quality of life - will undoubtedly improve.
So this winter’s heavy snow and cold in the NH is not just a US problem. It is interesting though to note that snow spin seems to span continents.
Before they were saying that increased winter snow is due to global warming, climate scientists were saying that decreased winter snow was due to global warming. As discussed already on WUWT, climate models predict declining winter snow cover. And a senior climate scientist predicted ten years ago :
According to Dr David Viner, a senior research scientist at the climatic research unit (CRU) of the University of East Anglia,within a few years winter snowfall will become “a very rare and exciting event”. “Children just aren’t going to know what snow is,” he said.
There is no shortage of similar claims:
Decline in Snowpack Is Blamed On Warming Using data collected over the past 50 years, the scientists confirmed that the mountains are getting more rain and less snow
Many Ski Resorts Heading Downhill as a Result of Global Warming
The prediction below was particularly entertaining, given that it was made during Aspen’s all time snowiest winter.
Tuesday, December 16, 2008
DENVER - A study of two Rocky Mountain ski resorts says climate change will mean shorter seasons and less snow on lower slopes. The study by two Colorado researchers says Aspen Mountain in Colorado and Park City in Utah will see dramatic changes even with a reduction in carbon emissions, which fuel climate change. Skiing at Aspen, with an average temperature 8.6 degrees higher than now, will be marginal.
Global Warming Poses Threat to Ski Resorts in the Alps Climatologists say the warming trend will become dramatic by 2020
Global Warming Poses Threat to Ski Resorts in the Alps - New York Times
Himalayan snow melting in winter too, say scientists Himalayan snow melting in winter too, say scientists - SciDev.Net
Global warming ‘past the point of no return’ Friday, 16 September 2005 Global warming ‘past the point of no return’ - Science, News - The Independent
So what are they saying now?
Global Warming could equal massive snow storms Great Lakes and Global Warming could equal massive snow storms
Snow is consistent with global warming, say scientists Britain may be in the grip of the coldest winter for 30 years and grappling with up to a foot of snow in some places but the extreme weather is entirely consistent with global warming, claim scientists. Snow is consistent with global warming, say scientists - Telegraph
Climate Scientist: Record-Setting Mid-Atlantic Snowfall Linked to Global Warming
The Blizzard of 1996 does indeed qualify as one type of extreme weather to be expected in a warmer climate Blame Global Warming for the Blizzard - NYTimes.com
The great thing about global warming is that you can blame anything on it, and then deny it later. See post and comments here.
See recent account of Snowmagedden here.
Feb 23, 2010
Record Setting AO and SOI combo creates a wild winter
By Joseph D’Aleo
In April 2009, we talked about Mt Redoubt’s eruption (and later Russia’s Sarychev) and the effect it might have on high latitude blocking and cooler summer and winter.
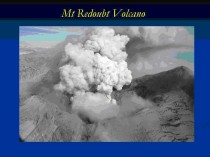
Climatologists may disagree on how much the recent global warming is natural or manmade but there is general agreement that volcanism constitutes a wildcard in climate, producing significant global scale cooling for at least a few years following a major eruption. However, there are some interesting seasonal and regional variations of the effects.
Oman et al (2005) and others have shown that though major volcanic eruptions seem to have their greatest cooling effect in the summer months, the location of the volcano determines whether the winters are colder or warmer over large parts of North America and Eurasia. According to their modeling, tropical region volcanoes like El Chichon and Pinatubo actually produce a warming in winter due to a tendency for a more positive North Atlantic Oscillation (NAO) and Arctic Oscillation (AO). In the positive phase of these large scale pressure oscillations, low pressure and cold air is trapped in high latitudes and the resulting more westerly jet stream winds drives milder maritime air into the continents.
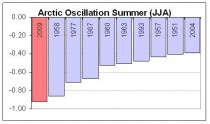
The summer of 2009 had the most negative AO since 1950. Which explains the cold summer (especially July) (below, enlarged here).
.
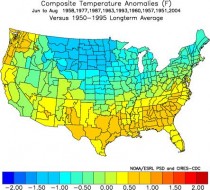
Summers with a very negative AO above have a cold anomaly centered in the nation’s midsection (below, enlarged here).
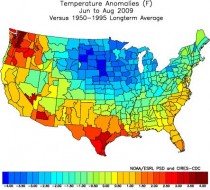
Last summer saw that pattern (below, enlarged here).
The AO has stayed very negative this winter. In fact again the most negative of any winter since 2009/10. It has averaged almost 3.5 standard deviations negative. In both December and February, it has reached more then 5 STD (below, enlarged here).
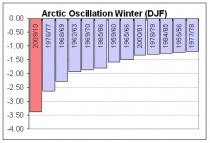
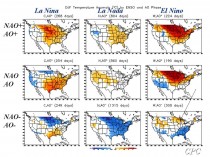
Negative AO/NAO winters are cold and often snowy in the US and Europe (below, enlarged here).
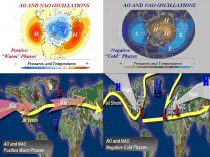
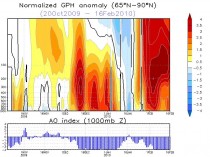
The strongest blocking years have a warm polar stratosphere and mid troposphere. Certainly that has been the case this year. (below, enlarged here).
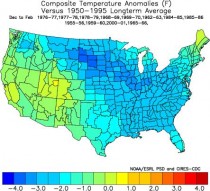
The most negative years when composited show widespread cold (below, enlarged here).
This winter has been cold especially in the central and southeast through February 16th (below, enlarged here).
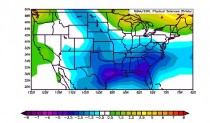
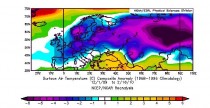
And certainly also all across Asia into Europe (below, enlarged here).
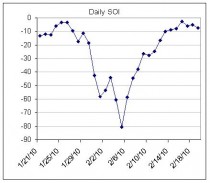
It also has been an El Nino year, the case in about half the top ten most negative AO years. The Southern Oscillation Index has dropped on a daily basis to an amazing 8 STD negative in early February. For the first 19 days, it has been most negative February since 1870.
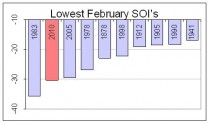
(Most negative SOI Februarys enlarged here).
The pattern show a good match this year to El Nino negative AO years (bottom right below, enlarged here).
See more here. Listen to this PODCAST (episodes on left #21) on November 10 on WeatherJazz which I did with fellow meteorologist Andre Bernier on long range forecasting and the upcoming winter where we predicted east coast storms and a negative AO/NAO based on natural factors.
Feb 23, 2010
Brrrr, the thinking on climate is frozen solid
By Dominic Lawson, Times Online
Here’s how it is down our way. The oil tank that powers our central heating is running worryingly low, but for days fuel lorries have been unable to navigate the frozen track that links us to the nearest main road. We would have gained much welcome heat from incandescent light bulbs, but as those have been banned by the government as part of the “fight against climate change”, no such luck.
On the good side, the absence of delivered newspapers - even the faithful paperboy has given up the unequal struggle to reach us - means I won’t be getting any more headaches from attempting to read newsprint under the inadequate light shed by “low-energy” bulbs. Nevertheless, the news has reached our Sussex farmhouse that the Conservatives have already begun the general election campaign, covering hoardings nationwide with pictures of David Cameron looking serious.
Many will be appalled by the promise of months of being force-fed with party political argument. There is something much worse than being confronted with non-stop debate, however: it is the prospect of being offered no choice and no debate when all three main parties have the same policy. This is what happened in the general election of 1992, when the Conservative government and its Labour and Liberal Democrat opponents were united in the view that sterling should remain linked to the deutschmark via the exchange-rate mechanism (ERM). This had been forcing the unnecessary closure of thousands of businesses as Bank of England interest rates went up and up to maintain an exchange rate deemed morally virtuous by the entire political establishment - and, indeed, by every national newspaper.
As everyone now knows (and as we deeply unfashionable “ERM deniers” warned at the time), it would all end in tears. A few months after that general election, the re-elected Conservative government was compelled by the forces of reality to abandon this discredited bulwark of its economic policy, a humiliation that destroyed the Tories’ reputation for competence or even common sense.
Now, almost a generation later, we face another election in which the main parties are united in a single masochistic view: that the nation must cut its carbon emissions by 80% - this is what all but five MPs voted for in the Climate Change Act - to save not just ourselves but also the entire planet from global warming. For this to happen - to meet the terms of the act, I mean, not to “save the world” - the typical British family will have to pay thousands of pounds a year more in bills, since the cost of renewable energy is so much higher than that of oil, gas and coal.
The vast programme of wind turbines for which the bills are now coming in will not, by the way, avert the energy cut-offs declared last week by the national grid. Quite the opposite: as is often the case, the recent icy temperatures have been accompanied by negligible amounts of wind. If we had already decommissioned any of our fossil-fuel power stations and replaced them with wind power, we would now be facing a genuine civil emergency rather than merely inconvenience.
There are other portents of impending crisis caused entirely by the political fetish of carbon reduction. As noted in this column three weeks ago, the owners of the Corus steel company stand to gain up to $375m in European Union carbon credits for closing their plant in Redcar, only to be rewarded on a similar scale by the United Nations’ Clean Development Mechanism fund for switching such production to a new “clean” Indian steel plant. That’s right: the three main British political parties - under the mistaken impression that CO2 is itself a pollutant - are asking us to vote for them on the promise that they are committed to subsidise the closure of what is left of our own industrial base.
The collapse of the UN’s climate change summit in Copenhagen makes such a debacle all the more likely. Countries such as India, China and Brazil have made it clear they have not the slightest intention of rejecting the path to prosperity that the developed world has already taken: to use the cheapest sources of energy available to lift their peoples out of hardship, extreme poverty and isolation. Britons may be forced by their own government to cut their carbon emissions - equivalent to less than 2% of the world’s total; but we can forget about the idea that this will encourage any of those much bigger countries to defer their own rapid industrialisation.
Just as the British public never shared the politicians’ unanimous worship of the ERM totem (which is why the voters’ subsequent vengeance upon the governing Tories was implacable), so the public as a whole is much less convinced by the doctrine of man-made global warming than the Palace of Westminster affects to be: the most recent polls suggest only a minority of the population is convinced by the argument. This has caused some of the more passionate climate change catastrophists to question the virtues of democracy and to hanker after a dictatorial government that would treat such dissent as treason. As Professors Nico Stehr and Hans von Storch warned in Der Spiegel last month: “Climate policy must be compatible with democracy; otherwise the threat to civilisation will be much more than just changes to our physical environment.”
The threat of a gulf between a sceptical public and a political class determined - as it would see it - on saving us from the consequences of our own stupidity can have only been increased by the Arctic freeze that has enveloped not just Britain but also the rest of northern Europe, China and the United States. Of course one winter’s unexpected savagery does not in itself disprove any theories of man-made global warming, as the climate change gurus are hastily pointing out. Steve Dorling, of the University of East Anglia’s school of environmental sciences - yes, the UEA of “climategate” email fame - warns that it is “wrong to focus on single events, which are the product of natural variability”.
Quite so; but it would be easier to accept the point that a particular episode of extreme and unexpected cold was entirely due to “natural variations” if the UEA’s chaps had not been so adept at publicising every recent drought or heatwave as possible evidence of “man’s impact”, and if David Viner (then a senior climate scientist at UEA) had not made a headline in The Independent a decade ago by warning that in a few years “British children just aren’t going to know what snow is”.

A period of humility and even silence would be particularly welcome from the Met Office, our leading institutional advocate of the perils of man-made global warming, which had promised a “barbecue summer” in 2009 and one of the “warmest winters on record”. In fact, the Met still asserts we are in the midst of an unusually warm winter - as one of its staffers sniffily protested in an internet posting to a newspaper last week: “This will be the warmest winter in living memory, the data has already been recorded. For your information, we take the highest 15 readings between November and March and then produce an average. As November was a very seasonally warm month, then all the data will come from those readings.”
After reading this I printed it off and ran out into the snow to show it to my wife, who for some minutes had been unavailingly pounding up and down on our animals’ trough to break the ice. She seemed a bit miserable and, I thought, needed cheering up. “Darling,” I said, “the Met Office still insists that we are enjoying an unseasonably warm winter.”
“Well, why don’t you tell the animals, too?” she said. “Because that would mean they are drinking water instead of staring at a block of ice and I am not jumping up and down on it in front of them like an idiot.” See post here.
-------------------------
Bleak winter partly caused by El Nino could be worst for 31 years
By Paul Simons, Time Online Weatherman
The long, hard winter looks like dragging on into March. And if the bitter winds carry on for the next two weeks, there is a very good chance that this winter will turn out to be the coldest across the UK since 1979.
The National Trust reports that spring flowers have been set back by up to four weeks compared with recent years, although they expect that when some decent warmth arrives it could unleash a huge burst of flowering.
In the latest outbreak of wintry weather, heavy snow swamped much of the South West, Wales, the Midlands and parts of East Anglia, with the threat of ice on those roads not covered with snow. There’s a risk of a similar snowfall returning on Monday, stretching from the M4 corridor across Wales, the Midlands, East Anglia and parts of the North.

These snowfalls have come from a collision of wet, mild, Atlantic air smashing into freezing colder air stuck over northern parts of Britain. This stems from a problem that has plagued much of this winter - the weather patterns have become blocked and sent the jet stream running south.
Predicting weather ahead is in its infancy
This wind runs a few miles high and marks the battlefront between Arctic air and tropical air, and usually lies close to the UK during winter, delivering mild but wet weather. This winter, though, bitterly cold air from the Arctic thrust down into Europe and sent the jet stream off-course.
And the same happened in the eastern US, where the bitter cold has produced monster-sized snowfalls that have set new records in many places.
While much of Europe, North America and Asia have shivered, other places have been ridiculously warm. Just like squeezing a balloon, mild air has shifted to other regions such as Vancouver, where the Winter Olympics are in dire trouble with incredibly warm weather, heavy rains and fog.
The blame for this mess is partly thanks to El Nino, the warming of the tropical seas of the Pacific, which causes a huge upheaval in weather patterns across much of the globe.
This current El Nino is fairly powerful, and has swept warm air across Alaska and the West Coast of Canada, which is why Vancouver broke its record for the warmest January. Even the UK has caught the turmoil from El Niño, despite being thousands of miles away. Warm air from El Niño shot up into the stratosphere and shunted a surge of cold air from the Arctic down across the Continent and the UK this month.
Despite the snow and recent rain, this winter could turn out to be one of the driest on record, based on Met Office figures up to February 15. Although snowfalls through January and February were often heavy, they did not amount to much in terms of rainfall. Even showers forecast next week will not substantially change the average rainfall for the whole winter. Read post here.
Feb 17, 2010
IPCC’s latest great source: a newsletter than doesn’t even back its scare
Andrew Bolt, Herald Sun
The Air Vent discovers another supposedly impeccable, peer-reviewed source for the IPCC’s alarmist claims in its 2007 report. The claim in question:
Climate variability affects many segments of this growing economic sector [Tourism]. For example, wildfires in Colorado (2002) and British Columbia (2003) caused tens of millions of dollars in tourism losses by reducing visitation and destroying infrastructure (Associated Press, 2002; Butler, 2002; BC Stats, 2003).
The Air Vent:
That’s two newspaper articles and one tourism statistics newsletter. I can’t find the first two articles, one is an old AP story and the other was in a newspaper that folded last year.
That doesn’t sound very scientific. And, in fact, the one source able to be checked - and the only one dealing with the impact of fires in British Columbia - shows no evidence for the IPCC claim. Here is the relevant passage from BC Stats, 2003: Tourism Sector Monitor - November 2003, British Columbia Ministry of Management Services, Victoria, 11 pp. [Accessed 09.02.07]:
Tourism is a seasonal phenomenon. The wildfires unfortunately burned mostly during July, August and September, the three months of the year when most room revenues are typically generated. More precisely, establishments generated 38% of their annual room revenues in these three months between 1995 and 2001. Moreover, the forest fires were at their peak in August, also the peak month for tourism. Despite this bad timing, the peak of the 2003 season does not appear to be lower than the peak of previous years.
The Air Vent rightly concludes:
Once again, I am not saying that their claim is wrong. I am only underlining that their sources don’t match their claims. This shows that the IPCC already had a point of view, and they simply wanted a source to back up their claims. They found this BC Stats, probably didn’t read it because they figured it must show that fires reduce tourism, and cited it as the source of their claim. The IPCC makes a conclusion, then looks for evidence that supports their claims, and cite it. Sometimes they even cite evidence that doesn’t support their claims. Since no one read it for 2 years, they almost got away with it. This isn’t how a reputable scientific organization works.
Read Andrew’s post here.
Feb 15, 2010
Now IPCC hurricane data /Trenberth questioned
By Andrew Orlowski, The UK Register
More trouble looms for the IPCC. The body may need to revise statements made in its Fourth Assessment Report on hurricanes and global warming. A statistical analysis of the raw data shows that the claims that global hurricane activity has increased cannot be supported.
Les Hatton once fixed weather models at the Met Office. Having studied Maths at Cambridge, he completed his PhD as metereologist: his PhD was the study of tornadoes and waterspouts. He’s a fellow of the Royal Meterological Society, currently teaches at the University of Kingston, and is well known in the software engineering community - his studies include critical systems analysis.
Hatton has released what he describes as an ‘A-level’ statistical analysis, which tests six IPCC statements against raw data from the National Oceanic and Atmospheric (NOAA) Administration. He’s published all the raw data and invites criticism, but warns he is neither “a warmist nor a denialist”, but a scientist.
Hatton performed a z-test statistical analysis of the period 1999-2009 against 1946-2009 to test the six conclusions. He also ran the data ending with what the IPCC had available in 2007. He found that North Atlantic hurricane activity increased significantly, but the increase was counterbalanced by diminished activity in the East Pacific, where hurricane-strength storms are 50 per cent more prevalent. The West Pacific showed no significant change. Overall, the declines balance the increases.
“When you average the number of storms and their strength, it almost exactly balances.” This isn’t indicative of an increase in atmospheric energy manifesting itself in storms.
Even the North Atlantic increase should be treated with caution, Hatton concludes, since the period contains one anomalous year of unusually high hurricane activity - 2005 - the year Al Gore used the Katrina tragedy to advance the case for the manmade global warming theory.
The IPCC does indeed conclude that “there is no clear trend in the annual numbers of tropical cyclones.” If only the IPCC had stopped there. Yet it goes on to make more claims, and draw conclusions that the data doesn’t support.
Claims and data
Thre IPCC’s WG1 paper states: “There are also suggestions of increased intense tropical cyclone activity in some other regions where concerns over data quality are greater.” Hatton points out the data quality is similar in each area.
The IPCC continues: “It is more likely than not (> 50%) that there has been some human contribution to the increases in hurricane intensity.” But, as Hatton points out, that conclusion comes from computer climate models, not from the observational data, which show no increase.
“The IPCC goes on to make statements that would never pass peer review,” Hatton told us. A more scientifically useful conclusion would have been to ask why there was a disparity. “This differential behaviour to me is very interesting. If it’s due to increased warming in one place, and decreased warming in the other - then that’s interesting to me.”
Hatton has thirty years of experience of getting scientific papers published, but describes this one, available on his personal website, as “unpublishable”.
“It’s an open invitation to tell me I’m wrong,” he says. He was prompted to look more closely by the Climategate emails, and by his years of experience with computer modelling. All code and data on which policy conclusions are made should be open and freely downloadable, he says - preferably with open tools.
You can download both the paper and the code and tools from here.
Bootnote
The IPCC’s AR4 chapter lead was Kevin Trenberth, who features prominently in the Climategate emails. In 2005, the National Hurricane Center’s chief scientist Chris Landsea resigned his post in protest at the treatment of the subject by Trenberth.
“I personally cannot in good faith continue to contribute to a process that I view as both being motivated by pre-conceived agendas and being scientifically unsound. As the IPCC leadership has seen no wrong in Dr. Trenberth’s actions and have retained him as a Lead Author for the AR4, I have decided to no longer participate in the IPCC AR4.”
Critics point out that an increase in low-intensity storms being recorded is due to better instrumentation. Most are at sea, and thanks to radar and satellites, more are now observed. Read more here.
---------------------
Climategate U-turn as scientist at centre of row admits: There has been no global warming since 1995
By Jonathan Petre, UK Daily Mail
* Data for vital ‘hockey stick graph’ has gone missing!
* There has been no global warming since 1995!
* Warming periods have happened before - but NOT due to man-made changes!
* Data: Professor Phil Jones admitted his record keeping is ‘not as good as it should be’

The academic at the centre of the ‘Climategate’ affair, whose raw data is crucial to the theory of climate change, has admitted that he has trouble ‘keeping track’ of the information. Colleagues say that the reason Professor Phil Jones has refused Freedom of Information requests is that he may have actually lost the relevant papers.
Professor Jones told the BBC yesterday there was truth in the observations of colleagues that he lacked organisational skills, that his office was swamped with piles of paper and that his record keeping is ‘not as good as it should be’. The data is crucial to the famous ‘hockey stick graph’ used by climate change advocates to support the theory.
Professor Jones also conceded the possibility that the world was warmer in medieval times than now - suggesting global warming may not be a man-made phenomenon. And he said that for the past 15 years there has been no ‘statistically significant’ warming.
The admissions will be seized on by sceptics as fresh evidence that there are serious flaws at the heart of the science of climate change and the orthodoxy that recent rises in temperature are largely man-made. Professor Jones has been in the spotlight since he stepped down as director of the University of East Anglia’s Climatic Research Unit after the leaking of emails that sceptics claim show scientists were manipulating data.
The raw data, collected from hundreds of weather stations around the world and analysed by his unit, has been used for years to bolster efforts by the United Nation’s Intergovernmental Panel on Climate Change to press governments to cut carbon dioxide emissions. Following the leak of the emails, Professor Jones has been accused of ‘scientific fraud’ for allegedly deliberately suppressing information and refusing to share vital data with critics.
Discussing the interview, the BBC’s environmental analyst Roger Harrabin said he had spoken to colleagues of Professor Jones who had told him that his strengths included integrity and doggedness but not record-keeping and office tidying. Mr Harrabin, who conducted the interview for the BBC’s website, said the professor had been collating tens of thousands of pieces of data from around the world to produce a coherent record of temperature change. That material has been used to produce the ‘hockey stick graph’ which is relatively flat for centuries before rising steeply in recent decades.
According to Mr Harrabin, colleagues of Professor Jones said ‘his office is piled high with paper, fragments from over the years, tens of thousands of pieces of paper, and they suspect what happened was he took in the raw data to a central database and then let the pieces of paper go because he never realised that 20 years later he would be held to account over them’.
Asked by Mr Harrabin about these issues, Professor Jones admitted the lack of organisation in the system had contributed to his reluctance to share data with critics, which he regretted.
But he denied he had cheated over the data or unfairly influenced the scientific process, and said he still believed recent temperature rises were predominantly man-made. Asked about whether he lost track of data, Professor Jones said: ‘There is some truth in that. We do have a trail of where the weather stations have come from but it’s probably not as good as it should be. There’s a continual updating of the dataset. Keeping track of everything is difficult. Some countries will do lots of checking on their data then issue improved data, so it can be very difficult. We have improved but we have to improve more.’
He also agreed that there had been two periods which experienced similar warming, from 1910 to 1940 and from 1975 to 1998, but said these could be explained by natural phenomena whereas more recent warming could not. He further admitted that in the last 15 years there had been no ‘statistically significant’ warming, although he argued this was a blip rather than the long-term trend.
And he said that the debate over whether the world could have been even warmer than now during the medieval period, when there is evidence of high temperatures in northern countries, was far from settled. Sceptics believe there is strong evidence that the world was warmer between about 800 and 1300 AD than now because of evidence of high temperatures in northern countries. But climate change advocates have dismissed this as false or only applying to the northern part of the world.
Professor Jones departed from this consensus when he said: ‘There is much debate over whether the Medieval Warm Period was global in extent or not. The MWP is most clearly expressed in parts of North America, the North Atlantic and Europe and parts of Asia.
‘For it to be global in extent, the MWP would need to be seen clearly in more records from the tropical regions and the Southern hemisphere. There are very few palaeoclimatic records for these latter two regions. Of course, if the MWP was shown to be global in extent and as warm or warmer than today, then obviously the late 20th Century warmth would not be unprecedented. On the other hand, if the MWP was global, but was less warm than today, then the current warmth would be unprecedented.’ Sceptics said this was the first time a senior scientist working with the IPCC had admitted to the possibility that the Medieval Warming Period could have been global, and therefore the world could have been hotter then than now.
Professor Jones criticised those who complained he had not shared his data with them, saying they could always collate their own from publicly available material in the US. And he said the climate had not cooled ‘until recently - and then barely at all. The trend is a warming trend’. Mr Harrabin told Radio 4’s Today programme that, despite the controversies, there still appeared to be no fundamental flaws in the majority scientific view that climate change was largely man-made.
But Dr Benny Pieser, director of the sceptical Global Warming Policy Foundation, said Professor Jones’s ‘excuses’ for his failure to share data were hollow as he had shared it with colleagues and ‘mates’. He said that until all the data was released, sceptics could not test it to see if it supported the conclusions claimed by climate change advocates.
He added that the professor’s concessions over medieval warming were ‘significant’ because they were his first public admission that the science was not settled. Read more here.
|


